
234 U.S. cities scored 50 or higher in PeopleForBikes’ 2025 City Ratings, up from just 33 cities in 2019, signaling an improvement in bikeability in cities across the country.
 By Grace Stonecipher
Infrastructure Analytics and Research Manager
PeopleForBikes
Editor’s note: This text was first published online by PeopleForBikes on June 18, 2025, and is shared in The Lane with permission.
2025 marks the eighth year of City Ratings, PeopleForBikes’ annual, data-driven program evaluating the bikeability of nearly 3,000 cities across the U.S. and around the world. Generated using our Bicycle Network Analysis, City Ratings scores reflect the ease in which people can safely get from where they live to where they want to go via low-stress bike routes.
Scores are calculated on a scale of 0–100, with 50 considered a critical tipping point in building momentum to becoming a great city for biking. With updated scores each year, City Ratings allows city leaders and local bicycle advocates to track progress towards connected, safe bike networks in their communities.
High-scoring cities exhibit many or all of the components of PeopleForBikes’ SPRINT framework:
- Safe speeds
- Protected bike lanes
- Reallocated space for biking and walking
- Intersection treatments
- Network connections
- Trusted data
The City Ratings program continues to grow each year, with 241 new U.S. cities and 78 new international cities in 2025.
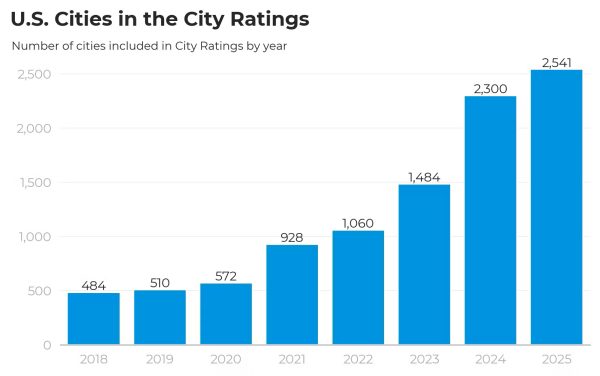
The majority of U.S. cities added to the program this year were small (+185) or medium (+51). The only new large cities for 2025 are the result of splitting New York City into its five boroughs. Don’t see your city in this year’s ratings? Fill out this form to have it added to the 2026 City Ratings.

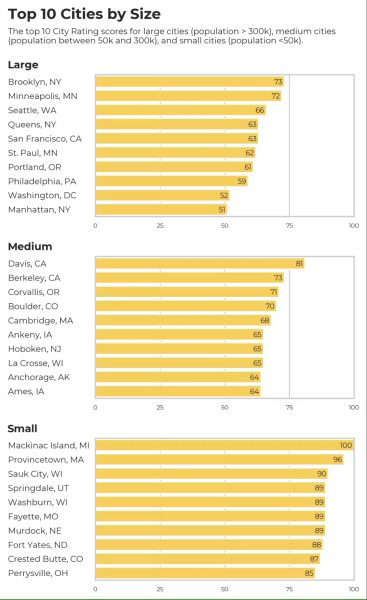
With the addition of the New York boroughs, Brooklyn took over as the best large U.S. city for biking with a score of 73. Last year’s top large city, Minneapolis, ranks a close second with a score of 72, followed by Seattle at 66. A couple of other New York boroughs, Queens and Manhattan, are also in the top 10, knocking out Denver and Milwaukee. However, Denver and Milwaukee still saw increases in their scores of one and two points, respectively. While most large cities saw similar marginal increases of one to two points, Washington D.C., saw the largest improvement with a score increase from 46 in 2024 to 52 in 2025. This shift means that all of the top 10 large U.S. cities have scores above 50, showcasing a nationwide commitment to improve bicycling in metropolitan areas.
The top 10 medium U.S. cities look very similar to 2024, though the order has shifted. The one newcomer is La Crosse, Wisconsin, which raised its score from 61 to 65. College towns dominate the medium cities, with Davis, California, (81) taking the top spot, ranking eight points higher than second-place Berkeley, California (73). Cambridge, Massachusetts; Ankeny, Iowa; and Ames, Iowa, all saw drops in their scores, though all three cities have active bike plans and remain in the top 10. These slight changes may be due to updated tags in OpenStreetMap, highlighting the importance of high quality data. Want to update the data for your city? Use this guide.
The car-free Mackinac Island, Michigan, remained at the top of the list for best small cities, becoming the first city in program history with a perfect score of 100. Fayette, Missouri; Sauk City, Wisconsin; and Perrysville, Ohio; are all new to the top 10 small cities this year, with Fayette seeing a nine-point leap from 2024. Seven of the top 10 small cities are located in Heartland states, indicating increasing momentum towards bike-friendly communities in the middle of the country.
In uplifting news, the average scores among top 10 cities increased for every size category compared to 2024. The average score across all U.S. cities also improved by one point over last year.

Large cities have a higher average score than small or medium cities, though small cities span a greater range of scores and have more cities scoring between 75–100.

234 U.S. cities have scores of 50 or above, up from 183 in 2024. Of the 51 new cities to reach this threshold, 21 were new to the program this year. The other 30 cities all crossed the critical tipping point thanks to dedicated investments in safe and connected places to ride and updating data in OpenStreetMap. Of the cities with scores of 50 or higher, 13 are large, 33 are medium, and 188 are small.

There are also many cities that have not yet crossed the 50-point threshold that are still showing big improvements. Typically, large cities show smaller increases from year to year due to the complexity of their road networks. In instances of large score increases, factors such as lowered speed limits or major data updates are often at play. For example, the 53-point increase for Hailey, Idaho, is due to the incorporation of a 25 mph residential speed limit citywide, which in turn increased low-stress access to the existing 20+ miles of bike paths through the town.

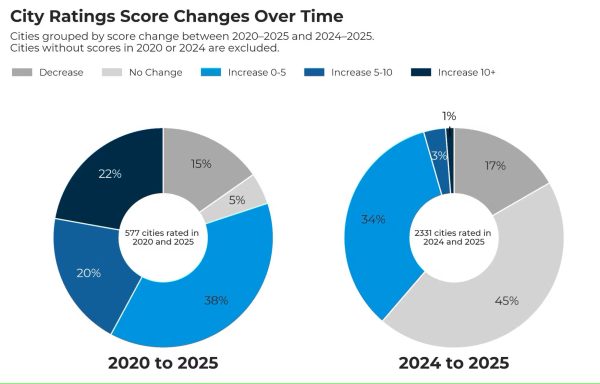
Since 2020, 80% of U.S. cities have improved their scores, with 22% improving by more than 10 points. In examining the changes from 2024 to 2025, 79% of city scores either stayed the same or increased moderately (between 0 and 5 points). However, it’s important to note that meaningful change on the ground takes time, and tracking scores across multiple years may provide more insight into progress than single-year improvements.
As in previous years, a trend of steady improvement is clear when looking at the top large cities over time. Most of the large cities improved by at least 1 point, aside from San Francisco and Manhattan, which each decreased by 1.

Examining scores at the state level can also provide some insight into geographic trends. Averages are calculated using population-weighting, giving more weight to the scores of cities with more people. Continuing the trend from 2024, Alaska held the top spot with an average population-weighted score of 58, down one point from last year. New York (56) took second place due to the high scores and high populations of the New York City boroughs, while Wisconsin and North Dakota both tied for third (48).
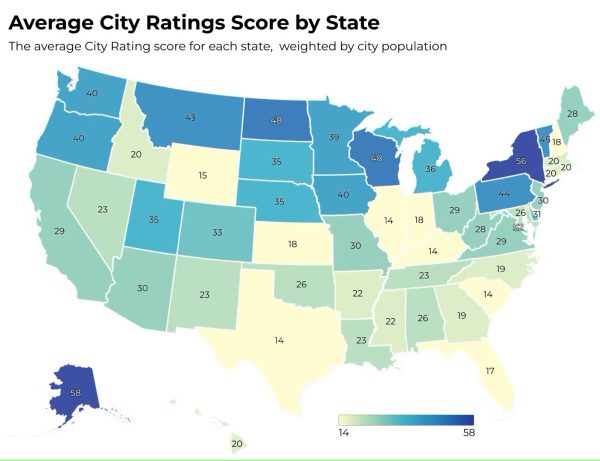
In general, northern states have higher average ratings than southern states, a fact which is also reflected in the regional population-weighted averages. With a regional average of 18, the South lags behind other parts of the country, although New England (21) isn’t far ahead.

With another year of City Ratings data and the associated maps available for viewing in the BNA, cities can now better explore the areas where they’re doing well with and identify opportunities for improvement. Overall, this year’s results continue to show positive trends towards better biking across the U.S., but a continued focus on bike-friendly policies and infrastructure investment will go a long way towards safer streets and more connected bike networks.
Back to The Lane
Signup For The Bike Lane Newsletter