
The Fourier Series is a method of approximating a periodic function with a sum of sine waves. This was invented as a means to solve the heat equation, which is impossible to derive for most initial conditions save for sine waves. The Fourier Series then could be used to approximate any initial condition as a sum of sine waves.
This project uses this method to take a SVG (which describes an image using a path verses a pixel array) and converts that to a array of points to draw a line through and then uses that array to build a stack of circles that approximate the path described by the SVG image.
var N = 1600 // number of input samples
var M = 100 // number of circles
var q = 20000 // number var N = 1600 // number of input samples
var M = 100 // number of circles
var q = 20000 // number of output samples
var viewbox = {width: 1080};
var setupDone = false;

var follow = true;

var DFT
var l
var P
var K
var t = 0;
//Step function
var first = false;
function aabs([re, im]) {
    return Math.hypot(re, im);
}

function expim(im) {
return [Math.cos(im), Math.sin(im)];
}

function add([rea, ima], [reb, imb]) {
    return [rea + reb, ima + imb];
}

function mul([rea, ima], [reb, imb]) {
    return [rea * reb - ima * imb, rea * imb + ima * reb];
}

let zoom;
let speed;
async function setup(){
    let svg = await fetch("https://gist.githubusercontent.com/mbostock/a4fd7a68925d4039c22996cc1d4862ce/raw/d813a42956d311d73fee336e1b5aac899c835883/fourier.svg")
        .then(response => response.text())
        .then(text => (new DOMParser).parseFromString(text, "image/svg+xml"))
        .then(svg => svg.documentElement);

    createCanvas(1080, 720);
    zoom = createSlider(10,50,10);
    speed = createSlider(1,10,1);
    viewbox = svg.viewBox.baseVal


    let path2 = svg.querySelector("path")
    l = path2.getTotalLength()
    P = Array.from({length: N}, (_, i) => {
        const {x, y} = path2.getPointAtLength(i / N * l);
        return [x - viewbox.width / 2, y - viewbox.height / 2];
    })
    console.log(P)

    K = Int16Array.from({length: M}, (_, i) => (1 + i >> 1) * (i & 1 ? -1 : 1))
    console.log(K);

    DFT = Array.from(K, k => {
        let x = [0, 0];
        for (let i = 0, N = P.length; i < N; ++i) {
        x = add(x, mul(P[i], expim(k * i / N * 2 * -Math.PI)));
        }
        return [x[0] / N, x[1] / N];
    })
    console.log(DFT);
    setupDone = true
}
var width = 1080;
const R = [];
function draw() {

    background(0);
    //translate(600, 600);


    if(setupDone){


        const scale2 = zoom.value()/10 * width / viewbox.width;
        const a = t * 2 / q * Math.PI;

        // Calculate the current point.
        let p = [0, 0];
        for (let i = 0; i < M; ++i) {
        p = add(p, mul(DFT[i], expim(a * K[i])));
        }

        // Zoom.

        translate(width / 2, height / 2);
        scale(scale2);
        if(follow) translate(-p[0], -p[1]);


        // Draw circles.
        noFill();
        stroke(75);
        for (let i = 0, p = [0, 0]; i < M; ++i) {
        const r = aabs(DFT[i]);
        ellipse(p[0], p[1],r*2);
        p = add(p, mul(DFT[i], expim(a * K[i])));
        }


        // Draw lines.
        /*
        context.beginPath();
        context.moveTo(0, 0);
        */
        stroke(125);
        for (let i = 0, p = [0, 0]; i < M; ++i) {
            prevP = p;
            p = add(p, mul(DFT[i], expim(a * K[i])))
            line(...prevP,...p);
        }


        // Draw the path.
        beginShape();
        noFill();
        stroke(255)
        if (R.length < q) R.push(p);
        for (let i = 1, n = R.length; i < n; ++i) {
            vertex(...R[i]);
        }
        endShape();
        t+=speed.value();
    }
}


function keyPressed(){
    if (key == "q"){
        follow = !follow;
    }
}
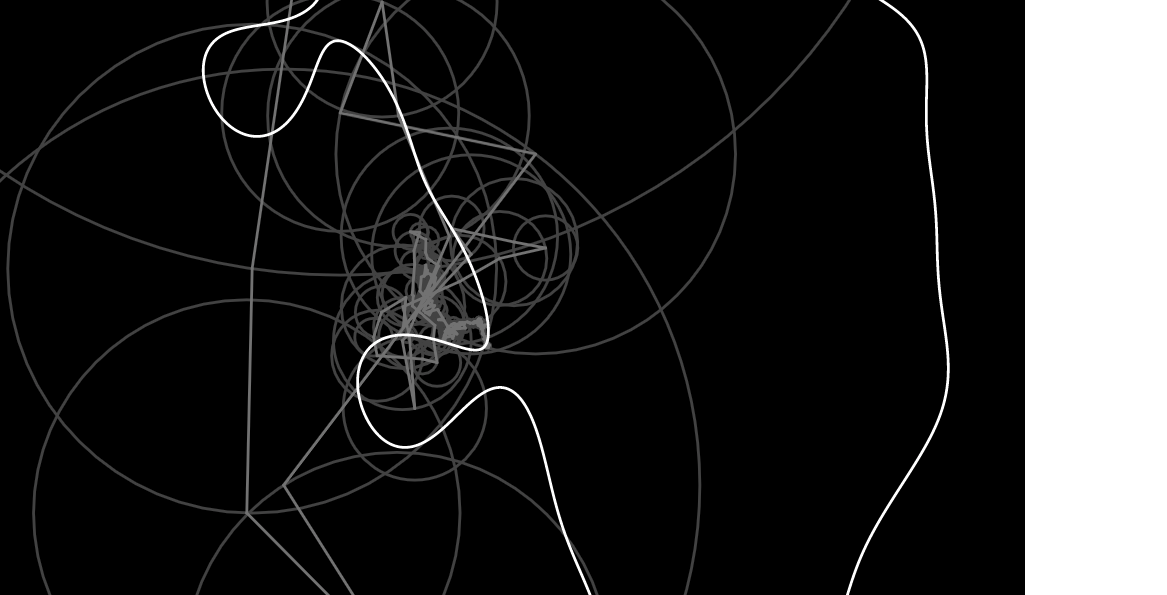
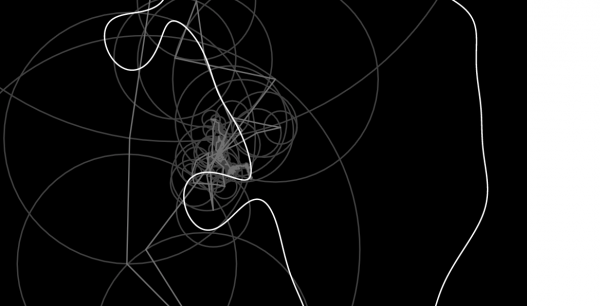
The above source code is uses the p5.js Library to animate the process described. Below are some images of this process.
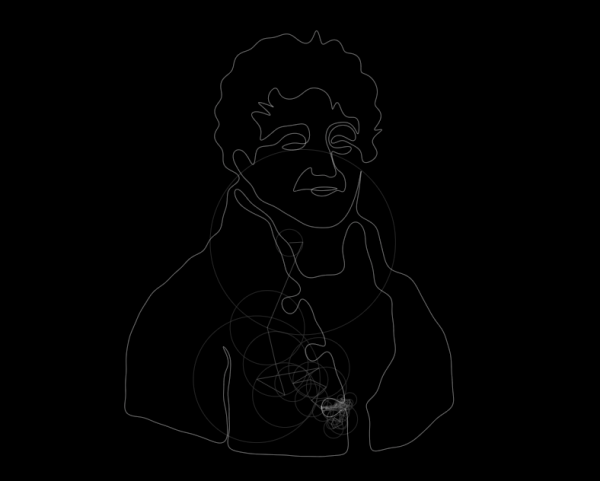
This post was originally written by Conner Wallace in July, 2019.